- Introduction of Fake News on Palm Oil Plantation
- The 24 Fake News on Oil Palm Plantation in Global Environment
- 1. Global warming is caused by oil palm plantations.
- 2. Indonesia is the world’s largest GHG emitter.
- 3. Consumption of fossil fuels is not the biggest contributor of GHG emissions.
- 4. Indonesia is the world’s largest fuel GHG emitter.
- 5. Indonesia’s population is the world’s largest GHG emitter.
- 6. Deforestation is the largest source of GHG emissions in the world.
- 7. Indonesia has the highest deforestation rate in the world.
- 8. Expansion of oil palm plantations biggest cause of global deforestation
- 9. The development of oil palm plantations in Indonesia has reduced the amount of forests in the country to be less than its minimum ecological requirement, like in other countries.
- 10. Indonesia has the largest peat land areas in the world so they need to be maintained as global carbon reserves.
- 11. Indonesia is the largest country deforesting and converting its peat land into agricultural areas.
- 12. Most global peat land is in the form of peat land forest and only Indonesia uses peat land for agriculture.
- 13. Indonesian agricultural sector is the biggest global agricultural GHG contributor.
- 14. Utilization of peat land for agriculture constitutes the biggest GHG emission source from global agriculture.
- 15. Global climate change is caused by expansion of oil palm plantations.
- 16. Forest and land fires in Indonesia are larger than in other countries.
- 17. Forest and land fires in Indonesia caused by oil palm plantations
- 18. Most forest fires occur in oil palm concessions.
- 19. Forest and land fires in Indonesia in 2015 was caused by palm oil producers.
- 20. Oil palm plantations cause flooding.
- 21. Oil palm plantations cause drought.
- 22. Oil palm plantations are the biggest GHG emitters in the farming sector.
- 23. Oil palm plantation development on peatland raises peatland GHG emissions.
- 24. Development of palm oil industry is against GHG emission reduction program.
Introduction of Fake News on Palm Oil Plantation
Global warming has become a common problem and has gained the attention of the international community. Global warming and its impacts such as the global shift in the climate map, climate anomalies, floods, droughts, storms, the rise of sea levels and so on, have caused great losses and even threatened the sustainability of life on earth.
The global warming issue has clearly become a very serious problem and needs a fundamental and holistic solution. Since the problem constitutes deterioration in the earth’s ecosystem quality, its solution has to be global. Each individual, each country needs to position itself as a part of the solution, to become a problem solver. For that, they need the same, equal and objective understanding about the causes of the global warming problem so that its solution can be found objectively as well.

The global warming issue has clearly become a very serious problem and needs a fundamental and holistic solution. Since the problem constitutes deterioration in the earth’s ecosystem quality, its solution has to be global. Each individual, each country needs to position itself as a part of the solution, to become a problem solver. For that, they need the same, equal and objective understanding about the causes of the global warming problem so that its solution can be found objectively as well.
On the other hand, a tradition of behaving and thinking in terms of a search for a scapegoat, building myths or shifting the problem to another party/nation, without any empirical facts that can be accounted for, is not part of the solution but part of the problem, being a problem maker, and creates new problems. Shifting the blame by building global public opinion on the principle that “lies which are repeated if they are reported intensively and widely then one day will be accepted as truth”, will not help solve the global environmental problem.
Here are the 24 fake news on oil palm plantation in global environment that palm oil competitors have raised as part of their negative campaigning.
The 24 Fake News on Oil Palm Plantation in Global Environment
1. Global warming is caused by oil palm plantations.
Global warming is not caused by the expansion of oil palm plantations but is due to increases in the intensity of GHG emissions affecting the earth’s atmosphere. Naturally the earth’s atmosphere is filled with GHGs especially water vapor (H2O), carbon dioxide (CO2), methane (CH4) and nitrogen (N2) in certain natural concentrations. Their function forms the mechanism of the natural greenhouse effect to protect and maintain the temperature of the earth’s atmosphere to be compatible with life. Through the mechanism of the natural GHG effect, a part of the sun’s energy is trapped in the earth’s atmosphere with the other part being reflected into outer space (Figure 1). Without the natural greenhouse effect, all solar energy would be reflected into outer space so that the temperature of the earth’s atmosphere would be very low and not compatible with life.
The intensity of the natural greenhouse effect increases when the GHG concentration in the earth’s atmosphere increases above its natural concentration. This is caused by rising CHG emissions from human activities on the earth and the emergence of man-made gases such as chlorofluorocarbons (CFCs) and halogen creating a human-enhanced greenhouse effect.

With the rising intensity of the greenhouse effect, the amount of radiation/solar energy that is trapped in the earth’s atmosphere also rises (Soemarwoto, 1992) from its natural condition, thereby making the earth’s temperature hotter. The increase in the temperature of the earth’s atmosphere, which we know as global warming is caused by the rising intensity of the greenhouse effect on the earth’s atmosphere.
According to the Intergovernmental Panel on Climate Change (IPCC, 1991) in the pre-industrial period up to the year 1990, CO2 in the earth’s atmosphere increased from 280 to 353 partsper million volume (ppmv). Meanwhile CH4 increased from 0.8 to 1.72 ppmv; N2O rose from 288 to 310 parts per billion volume (ppbv). And the CFC concentration increased from zero to 280-484 parts per trillion volume (pptv). And according to data from the International Energy Agency (IEA), the CO2 concentration in the earth’s atmosphere, which in 2005 reached 379 ppmv, increased to 396 ppmv in 2013 and to 399 ppmv in 2015 (IEA, 2016).
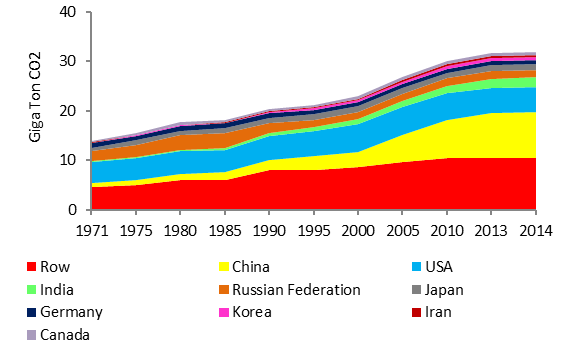
The increase in GHG concentrations in the earth’s atmosphere has been related to the activities of the global community since the pre-industrial era up to the present. According to the IEA (2016), the global GHG emission source is based on the GHG gas types, the largest of which is (Figure 2) from CO2 emissions (90 percent), followed by CH4 (9 percent) and N2O (1 percent).
2. Indonesia is the world’s largest GHG emitter.
Global GHG emissions until 2014 reached about 32.4 gigatons of CO2. Based on data from the IEA (2016) the largest GHG emitting countries (Figure 3) are China (28 percent), US (16 percent), India (6.2 percent) and Russia (5 percent).
GHG emissions from those 10 countries account for nearly half (58 percent) of global GHG emissions and are thus higher than the rest of the world (ROW). Indonesia, which contributes only 1.3 percent, is not even in the top 100 emitters. Therefore, the allegation that Indonesia is the largest global GHG emitter is incorrect and incompatible with existing data.
3. Consumption of fossil fuels is not the biggest contributor of GHG emissions.
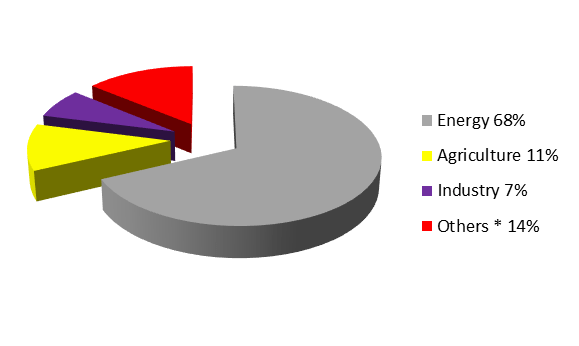
Based on IEA data (2016), total global GHG emissions in 2014 reached 47.6 gigatons of CO2. About 68 percent (32.4 gigatons) of the source of global GHG was from the global energy sector, starting from production process until fossil fuel consumption (Figure 4).
Meanwhile, global agriculture’s contribution only amounted to 11 percent, and industry 7 percent. Other sectors accounted for 14 percent, which included the burning of forest/peatland, emissions from peatland and waste.
This data shows that the use of fossil fuels constitutes the biggest global GHG emission source. Therefore, in order to reduce emissions, the global community has to be willing to reduce fossil fuel consumption or replace them with low-emission energy sources.
4. Indonesia is the world’s largest fuel GHG emitter.
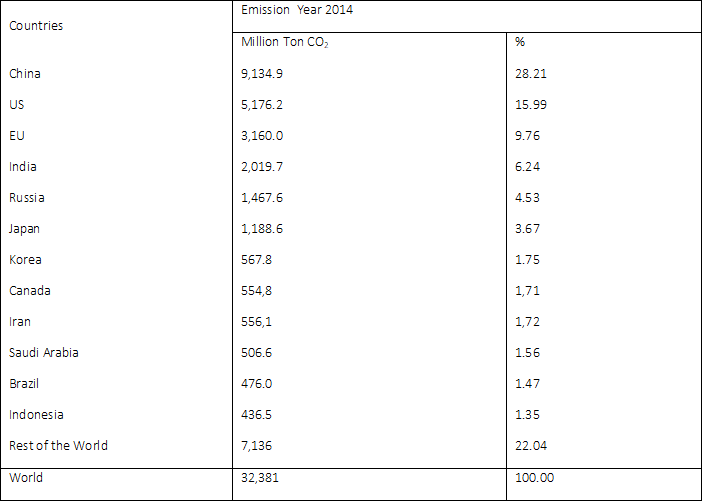
Indonesia is not the biggest global GHG emitter in the energy sector. On the contrary, Indonesia is one of the lowest emitting countries in the global energy sector. According to IEA data (2016), out of the 32.38 billion tons of CO2GHG emissions from global energy use in 2014 (Table 1) about 28 percent was produced by China, followed by the United States (16 percent) and the European Union (10 percent).
Indonesia’s contribution to global energy emissions is relatively small, namely about 1.3 percent. Therefore, it is not true that Indonesia is the biggest contributor of GHG emissions in the world energy sector.
Since 68 percent of total global GHG emissions is from energy emission, in order to resolve the global warming and global climate change problems fossil fuel consumption in the largest emitting countries has to be reduced. Energy consumption and GHG emissions of the largest global sources such as China, the European Union, United States and India have to be reduced to save the earth.
5. Indonesia’s population is the world’s largest GHG emitter.
Based on IEA data (2016), the Indonesian people are not the largest GHG-emission contributors as compared with people in other countries. The emissions of the Indonesian people are actually classified as among the lowest in the world.
The countries with the largest per capita emissions are Qatar, Kuwait, Luxemburg, Saudi Arabia and the United States whose per capita emission is over 16 ton of CO2. The per capita emission of the Indonesian people is classified as low, namely 1.7 tons of CO2, only about one 10th of the emissions of the people of the United States. The Indonesian per capita emission is even much lower than the average emission of the global population, below the average of European people and below the average of the people in OECD and Non-OECD countries.
Based on this data, in order to save the earth from further global warming and to prevent the global community from various forms of climate change impacts, the emissions of populations that are higher than Indonesia’s, such as Qatar, Kuwait, Luxemburg, Saudi Arabia, the United States, European Union, China, Singapore and others, have to be lowered.
Reducing emissions means reducing luxuries/welfare. Will people from the highest emitting countries reduce their luxuries? If they are willing to they should do so and not search for a scapegoat or shift the global warming/global climate change blame to the people of other countries with lower emissions, like the Indonesian people.
6. Deforestation is the largest source of GHG emissions in the world.
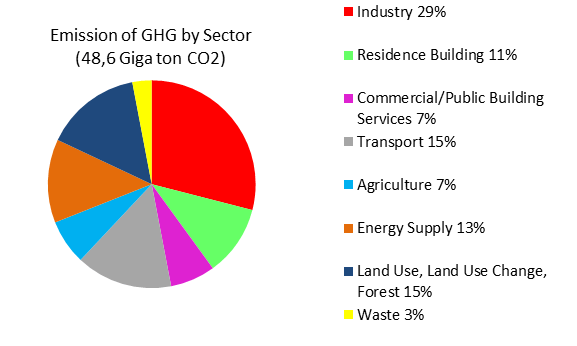
Agriculture and global deforestation are not the world’s largest GHG emission sources. The largest global GHG emission source based on sectors (Figure 5) is industry (29 percent), residential buildings (11 percent), commercial/public buildings (7 percent), transportation (15 percent), agriculture (7 percent), energy supply (13 percent), land use, land-use change, forest [LULUCF (15 percent)] and waste (3 percent).
Therefore it is very clear that the largest GHG-emission contributor is from energy consumption (BBF) by industry, transportation, housing, offices and energy supply, which account for 75 percent of the global GHG emissions. The share of agriculture, land use, land use change and forest (LULUCF) is only about 22 percent. If the global community wants to resolve global warming, the most effective way is by reducing the BBF consumption globally and in a revolutionary way.
Lifestyles and luxuries that are reliant on consuming too much BBF need to be reduced revolutionarily. Reducing GHG emissions from agriculture, land use change, including deforestation, would not have a significant impact if it is not preceded by reductions in BBF consumption.
7. Indonesia has the highest deforestation rate in the world.
Deforestation is a normal process and part of the development practice in every country. All urban regions, residential and agricultural areas in every country originate from deforestation. Even though global deforestation is a normal process in each country, Indonesia is not the country with the largest deforestation in the world.
The results of Matthew’s study (1983) showed that the start of development in temperate countries such as in Europe and North America resulted in the deforestation of 653 million hectares before the year 1980.
The European mainland experienced deforestation before the 1500s, deforestation in the US took place in the 1620-1920 period (www.globalchange.umich.edu). Meanwhile, in the same period countries in the tropical regions carried out deforestation only on 48 million hectares because development and the size of their populations were relatively still low.
However, since the 1980s when tropical countries and others have begun carrying out development and face population growth, deforestation has increased.
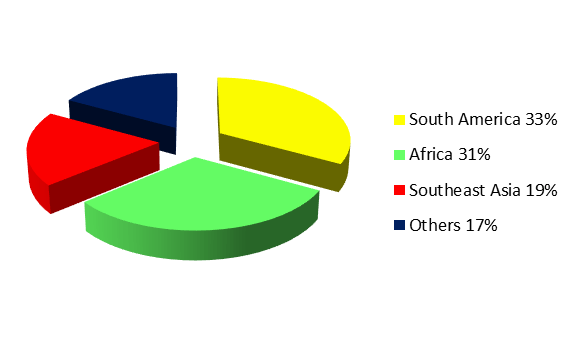
In the 1990-2008 period (European Commission, 2013) global deforestation reached 239 million hectares. About 33 percent of this deforestation took place in the United States (Figure 6) and 31 percent in Africa, while, Southeast Asia, where Indonesia is located, accounted for 19 percent.
With this global deforestation data, deforestation is seen as a part of normal development processes in each country. Despite it being a normal development process, deforestation in Indonesia is not the biggest source of global deforestation. Deforestation in North American and European regions (before 1980) and South American countries like Brazil and Argentina (1980-2008) was still much greater than the deforestation in Indonesia.
8. Expansion of oil palm plantations biggest cause of global deforestation
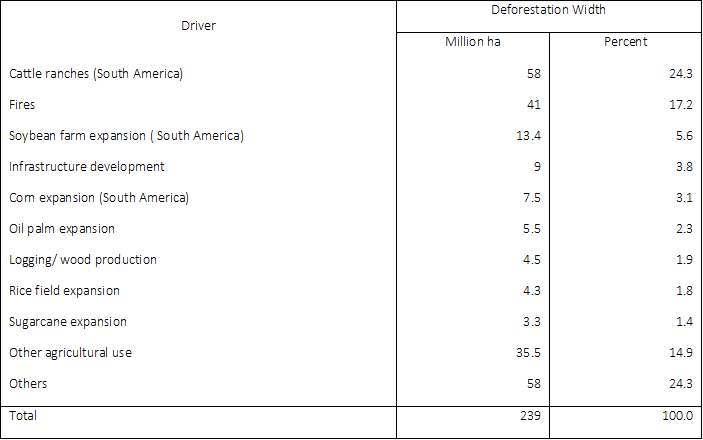
The scale of global deforestation in 1980 had already reached 701 million hectares (Matthew, 1983). Then in the 1990-2008 periods the total global deforestation was 239 million hectares (European Commission, 2013).
The cause of the 1990-2008 global deforestation (Table 4) was cattle ranch expansion (24.3 percent) especially in South America, fires (17.2 percent), soybean farm expansion (5.6 percent), the expansion of corn farms and sugarcane plantations (3.2 percent), while global oil palm expansion was only 2.3 percent.
Based on this data, oil palm plantations are not the main cause of global deforestation. Development of grazing areas, sugarcane plantations, soybean, rapeseed and sunflower farms are the main cause of global deforestation.
9. The development of oil palm plantations in Indonesia has reduced the amount of forests in the country to be less than its minimum ecological requirement, like in other countries.
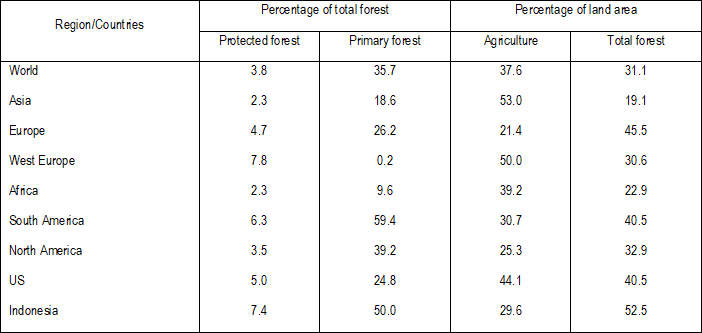
Based on international forestry data (FAO, 2013), the portion of Indonesian forest remains much better than that of other countries, or from the standpoint of the ecological requirement (Table 5).
In general, the minimum ecological requirement of forest to total land area as adopted in Regulation No. 41/1999 on Forestry and Regulation No. 20/2007 on Spatial Planning is a proportion of 30 percent. The proportion of forest area in Indonesia in 2013 was about 52 percent of total land area. Of the Indonesian forest area, about 50 percent constituted primary virgin forest.
The Indonesian forest proportion is still better than the forest proportions in India, China and European countries. It is even better than the forests in the US, both in terms of forest proportion to the total land area and the quality of forest, namely the primary forest portion.
Based on this data, it is not true that the forest proportions in Indonesia are under the ecological threshold. On the contrary, forests in Indonesia remain better compared to forest conditions in big countries and advanced nations.
10. Indonesia has the largest peat land areas in the world so they need to be maintained as global carbon reserves.
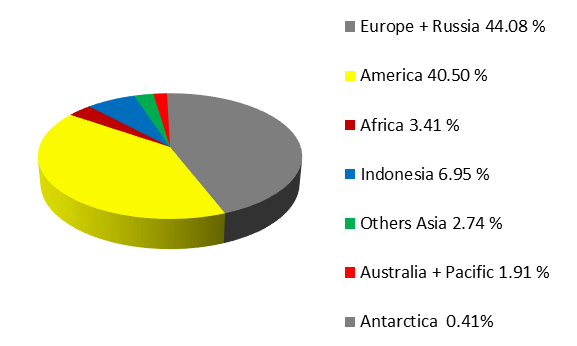
Based on data of Wetland International (2008), global peat land areas total 381.4 million hectares, which are divided (Figure 7) among Europe and Russia (44.08 percent), the Americas(40.5 percent), Africa (3.41 percent), Indonesia (6.95 percent), others Asia (2.74 percent), Australia and Pacific (1.91 percent) and Antarctica (0.41 percent).
Meanwhile, Russia is the largest area of 137.5 million ha, Canada has 113.4 million ha, the US has 22.4 million ha and Indonesia has 18.5 million ha. Therefore, Indonesia is not the owner of the largest amount of peat land in the world, but the fourth largest.
Of course, peat land needs to be preserved through protection or cultivated with regard to sustainable principles.
11. Indonesia is the largest country deforesting and converting its peat land into agricultural areas.
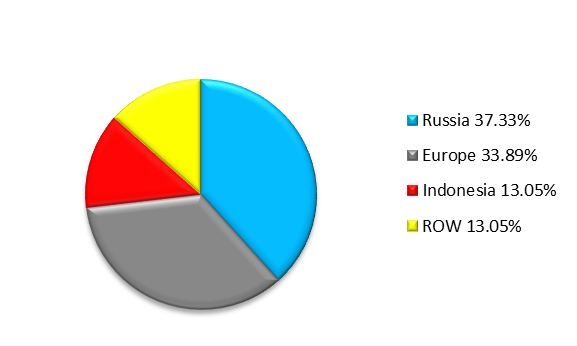
From 1990 to 2008 3.83 million ha of global peat land was converted into agricultural land or for other uses (Joosten, 2009). Of that, (Figure 8) about 37 percent happened in Russian and 33 percent in European peatland areas. About 13 percent of Indonesia’s peatland was also converted in that period.
Therefore, the largest peat land deforestation from 1990 to 2008 was not in Indonesia, but in Russia and Europe.
12. Most global peat land is in the form of peat land forest and only Indonesia uses peat land for agriculture.
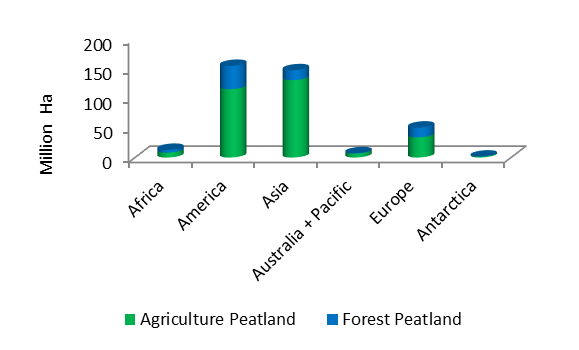
Based on the data of Wet International (2008), most global peat land (80 percent) is utilized for agricultural activities and only 20 percent is utilized for peat land forest (Figure 9). The use of peat land for agriculture in various regions is as follows: Africa (65 percent), the Americas (75 percent), Europe (67 percent) and Asia (89 percent).
Of the peat land used for agriculture (Figure 10), most of the 296.3 million ha is in the Asian region, followed by the American region. Russia, which has about 137 million hectares of peatland, uses 130 million hectares, about 94 percent, for agriculture.
The US, which has about 22 million ha of peat land, uses approximately 12.4 million ha (55 percent) for agriculture. Meanwhile, Indonesia (Agricultural Research and Development Agency, 2008), which has about 18.3 million ha of peat land, uses about 6.05 million ha for agriculture.
Therefore, it is not true that most global peat land is used for peat land forest and it is also not true that Indonesia is the country to use the most peat land for agriculture.
13. Indonesian agricultural sector is the biggest global agricultural GHG contributor.
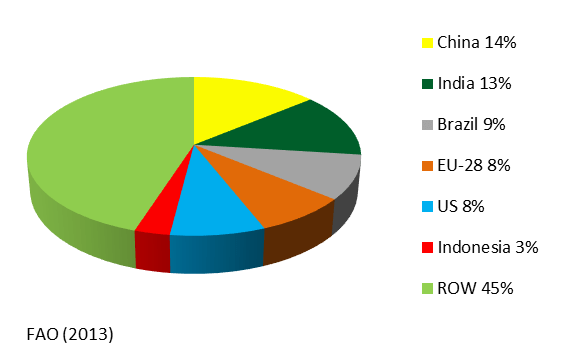
Data of global agricultural GHG emissions issued by FAO (2013) shows (Figure 11) that the main contributors of global agricultural GHG are the agriculture of China (14 percent), India (13 percent), Brazil (9 percent), the European Union (8 percent) and the US (8 percent). The five countries contribute 52 percent of total agricultural GHG emissions.
The GHG emissions contributed by the Indonesian agricultural sector is relatively small, only 3 percent. Therefore, an accusation that the Indonesian agricultural sector is the biggest global agricultural GHG contributor is not true and not supported by existing data.
14. Utilization of peat land for agriculture constitutes the biggest GHG emission source from global agriculture.
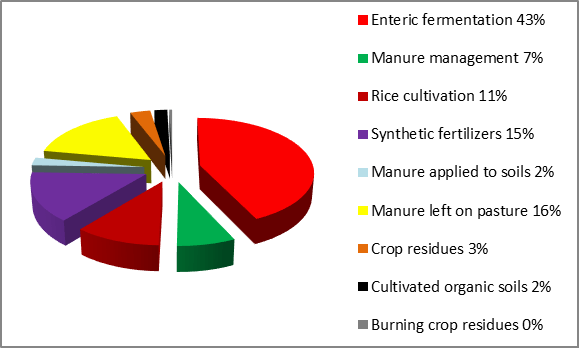
Data concerning global agricultural emissions issued by FAO (2013) shows (Figure 12) that the sources of global agricultural GHG emissions are enteric fermentation (43 percent), manure left on pasture (16 percent), the use of synthetic fertilizers (15 percent), rice cultivation (11 percent), manure management (7 percent), crop residues (3 percent), manure applied to soils (2 percent), cultivated organic soils (2 percent) and burning crop residues.
In other words, most (95 percent) of the emission sources of global agriculture is from activities of enteric fermentation, rice cultivation and use of factory fertilizer, while emissions from the peat land utilization is relatively small, namely only 2 percent.
15. Global climate change is caused by expansion of oil palm plantations.
Global climate change is an effect of global warming (IPCC, 1991; Soemarwoto, 1992; IEA, 2014). The rising amount of solar energy trapped in the Earth’s atmosphere leads to changes in global climate (Figure 13), like (1) rising evaporation, (2) warming/rising sea/ocean water temperature, (3) changes in the conditions of plants and animals and (4) melting snow and ice.
Combinations of the above-mentioned changes leads to various forms of global climate changes, such as the increasing rainfall, storms, droughts and fires, as well as climate anomalies.

Different forms of climate change occur and are felt in each country of the world. Therefore, global climate change is not caused by oil palm plantations in Indonesia.
16. Forest and land fires in Indonesia are larger than in other countries.
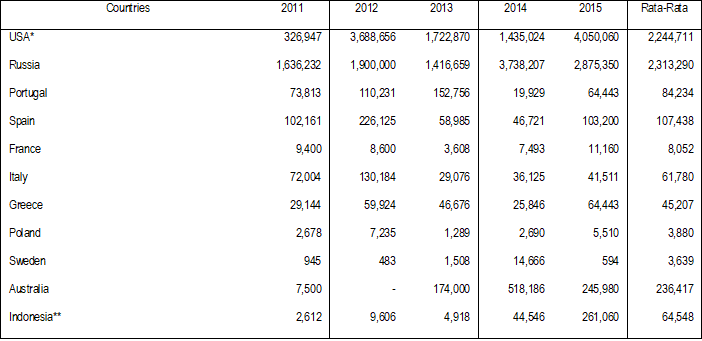
From 2010 to 2015, for example (Table 6), the average extent of forest and land fires in various countries remained high. In some countries they are even more extensive than in Indonesia. The area of forest and land fires in Russia reaches about 2.3 million ha each year; in the US it reaches 2.2 million
hectares; about 236,000 ha burn in Australia, about 107,000 in Spain and about 84,000 hectares in Portugal. The area of forest and land fires in those countries is larger than in Indonesia, where it is about 64,000 hectares per annum.
The data shows that global forest and land fires are not country specific, not ecosystem specific and not
industry/commodity specific either, but a global phenomenon that happens in nearly every country every year.
Environment and Forestry MinistryCountries that have the best technology and equipment, have management, government and a large amount of funds and a reliable community ethos, such as the US, Australia and European countries, are also unable to prevent forest and land fires. Forest and land fires are not related to whether there is
peat land and whether there are oil palm plantations. Russia, the US, Australia, Portugal and Italy do not have oil palm plantations, but forest and land fires also take place, even more than in Indonesia.
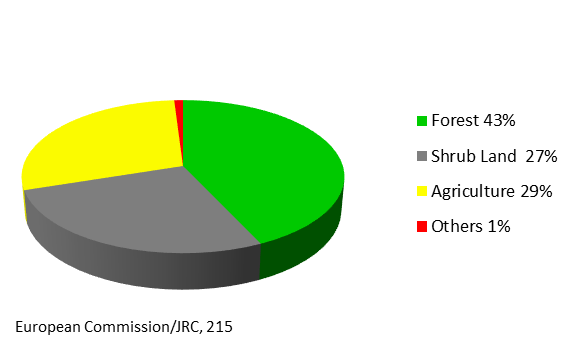
The interesting thing to learn is the distribution of fires based sector and land use (Figure 14). About 70 percent of fires in Europe and North Africa hit forests, timber estates and natural land and about 29 percent of fires take place on agriculture land. This shows that forest areas are the most being gutted by fire in each country.
A great many fires also hit agricultural land in nearly each country in Europe and North Africa. This raises interesting questions. Do farmers in advanced countries like Europe have habits like Indonesian farmers? Or is agriculture the victim of a spill-over of forest fires?.
17. Forest and land fires in Indonesia caused by oil palm plantations
Forest and land fires that happen in various countries also happen in Indonesia. Based on data from the Forestry and Environment Ministry of the Republic of Indonesia (2016), forest and land fires happen in a majority of provinces throughout Indonesia.
In several provinces with high concentrations of oil palm plantations such as Central Kalimantan, South Sumatra, East Kalimantan and Riau, forest and land fires have taken place in relatively large areas. However, forest and land fires covering relatively large areas also take place in provinces having no oil
palm plantations, such as Lampung, North Sulawesi, Gorontalo, Maluku, East Java, Central Java and West Java. Meanwhile, oil palm plantation-expansion provinces such as North Kalimantan and Bengkulu record relatively fewer forest fires compared with fires in Central Java and East Nusa Tenggara provinces, where there is no oil palm development.
Therefore, just as in other countries, forest and land fires in Indonesia are not systematically or specifically related to oil palm development. In fact forest and land fires can happen in provinces with or without oil palm development. Also, forest and land fires do not specifically hit peatland areas. East Java, West Nusa Tenggara and West Java, which do not have any peatland, also suffer from forest fires in relatively large areas.
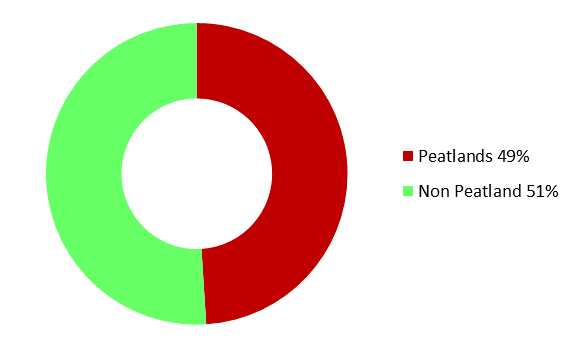
Forest and land fires not related to peatland are also confirmed by the spread of hotspots found in the July-November period 2015 (Figure 15). The spread of hotspots in peatland was even smaller than those outside peatland.
18. Most forest fires occur in oil palm concessions.
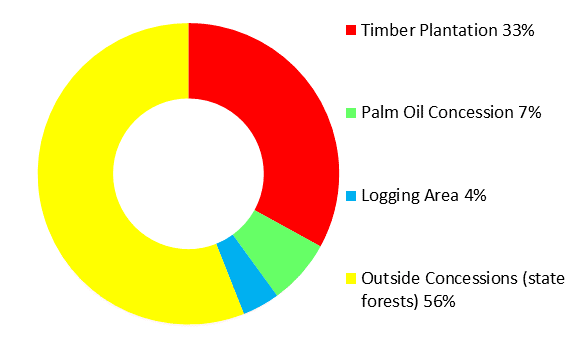
The spread of hotspots in November 2015 based on land use (Figure 16) shows a similar pattern of hotspots in other countries suffering from forest fires. About 56 percent of hotspots turned out to be outside oil palm concessions, namely primary forests managed by the government. This is followed by
production forest (HTI) concessions, at33 percent, while the hotspots in oil palm plantation concessions accounted for only 7 percent.
In other words, the biggest forest and land fires in Indonesia during the El Nino period of 2015 occurred in primary forests managed byte government. Linking the forest and land fires to oil palm plantations is not supported by current facts.
19. Forest and land fires in Indonesia in 2015 was caused by palm oil producers.
If one looks at the threat of heavy punishments for those setting forest fires, common sense says it is unlikely corporations would do this. Indonesian laws and regulations impose heavy sanctions on companies found to have deliberately set forest and land fires. The sanctions include imprisonment and heavy fines.
Article 78 paragraph 3 and paragraph 4 of the 2009 Forestry Law stipulates sentences of from five to 15 years or a fine of Rp 5 billion at the maximum for perpetrators of forest fires; while article 187 of the Criminal Code threatens a sentence of 12 years. Article 48 paragraph 1 of the 2004 Plantations Law, Article 108 of the 2009 Environmental Protection and Management Law stipulates sentences of up to 10 years and fines of up to Rp 10 billion.
Then there is Government Regulation No. 1502000 on the control of land damage for biomass production with sanctions against perpetrators, and referring to the 1997 Environment Management Law, which stipulates that perpetrators of environmental crimes are subject to: (1) confiscation of benefits obtained from the criminal acts; and/or (2) closure of whole or part of the company; and/or (3) reparation due to the criminal acts; and/or (4) obligation to work on what has been neglected without any rights; and/or (5) nullifying what has been neglected without any right; and/or (6) putting the company under supervision for three years at a maximum.
An examination of the weight of the sanctions and punishments imposed on perpetrators of land fires in corporations, shows it is hard to believe that plantation owners would risk their investments worth trillions of rupiah by setting forest and land fires to clear land to save a few billion rupiah. It would seem that only irrational entrepreneurs would carry out land clearance by burning.
Besides the heavy punishments, losses resulting from forest and land fires also cause declines in productivity of oil palm plantations. Results of a study by the Oil Palm Research Center disclose that impacts of drought alone can reduce productivity by 28-41 percent and yields by 06-2.5. Meanwhile, haze affects the process of formation and growth of oil palm fruit, thereby reducing productivity by about 0.2-5.5 percent. This means the potential loss per hectare due to declining productivity caused by forest and land fires in the surrounding areas could reach up to Rp 12-15 million per hectare.
With such potential losses in oil palm plantations caused by haze from fires, it is difficult to believe that oil palm plantations either individually or collectively carry out burning, which would cause losses to themselves. It is also difficult for common sense to accept that oil palm plantations deliberately left land fires in the surrounding areas unattended as that would cause losses in the form of productivity declines. Of course all have to share the responsibility for extinguishing fires, regardless of who initiates them.
20. Oil palm plantations cause flooding.
Flooding constitutes a part of global climate change. Therefore, flood disasters happen in nearly all countries throughout the world and there is no connection with oil palm plantations. Europe, North America, China, Australia and other regions that do not have oil palm plantations are also hit by flood disasters every year.
In Indonesia floods happen in various regions. According to data from the National Disaster Mitigation Agency (BNPB, 2017), the three provinces most frequently hit by major floods in the period between 2010 and 2016 were Central Java, East Java and West Java. Out of all national flood-disaster incidents in the 2010-2016 periods, 45 percent took place in these three provinces (average of 15 percent) as seen inTable 6.9. It is worth noting that these three provinces are not oil palm centers.
Five major oil palm provinces, namely Riau, North Sumatra, Central Kalimantan, South Sumatra,West Kalimantan and East Kalimantan were also hit by major floods like other provinces in Indonesia, but out of the major floods nationwide in the 2010-2016 period, only about 12 percent happened in the five major oil palm provinces (average of 2 percent).
Based on this data, it very clearly shows that flood disasters are a global phenomenon and they happen in many places. Flooding is not related to oil palm plantations and they actually most frequently take place in provinces with no oil palm plantations.
21. Oil palm plantations cause drought.
Drought is also a form of global climate change. The major droughts that occur in various countries also happen in regions throughout Indonesia.
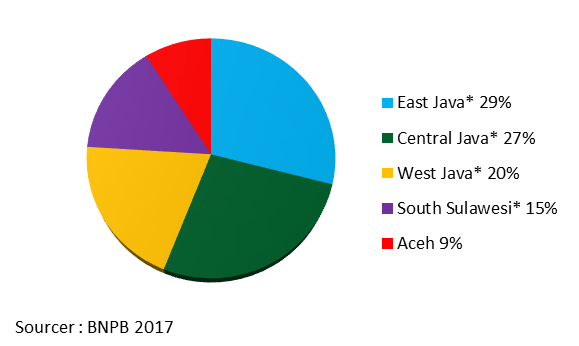
Based on data from the National Disaster Mitigation Agency (BNPB, 2017), the provinces most vulnerable to drought in the 2010-2016 period were East Java (29 percent), Central Java (27 percent), West Java (20 percent), South Sulawesi (15 percent) and Aceh (9 percent) (Figure 17).
Those areas, especially Central Java, East Java and West Java, where 76 percent of the national drought disasters happened, are not oil palm plantation regions. Aceh was the only oil palm center province included in the five worst provinces for drought.
Based on drought data, it can be concluded that drought occurs in various provinces that have no connection to oil palm plantations. Drought occurs in both oil palm-production provinces and non-oil palm production provinces. Indeed the provinces where the worst droughts happened, mostly on Java Island, are not oil palm plantation regions.
22. Oil palm plantations are the biggest GHG emitters in the farming sector.
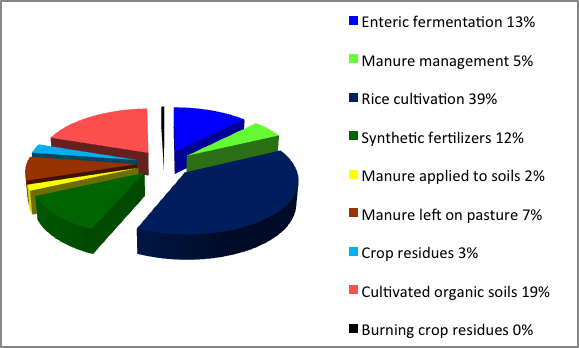
Based on data on Indonesian agriculture emissions issued by the FAO (2013), we can see (Figure 18) that the Indonesian agricultural sources of emission are enteric fermentation amounting to 13 percent, manure left on pasture 7 percent, synthetic fertilizers 12 percent, rice cultivation 39 percent, manure management 5 percent, crop residues 3 percent, manure applied to soils 2 percent, cultivated organic soils 9 percent and burning crop residues 0 percent.
Based on this data, the biggest source of Indonesian farming GHG emissions is rice-cultivation activities (39 percent) and activities related to animal husbandry (27 percent) so that the two commodities contribute 66 percent of the Indonesian farming GHG. Meanwhile, oil palm can be ascertained as not the main farming GHG contributor in Indonesia.
23. Oil palm plantation development on peatland raises peatland GHG emissions.
According to the report of Wetland International (Joosten, 2009), about 90 percent of Indonesian peatland constitutes degraded peatland. The utilization of peat land for oil palm plantations, according to various studies, turns out to have reduced peatland GHG emissions.
Secondary peatland GHG (degraded peat land) emissions amount to127 tons of CO2/hectare/year. By planting oil palm on peatland, GHG emissions decline to 55-57 tons of CO2/hectare/year (Melling. et al., 2005. 2007), Murayama and Bakar (1996). Hooijer (2006) found a smaller emissions figure, namely 54 tons of CO2/hectare/year. Even Germer and Sauaerborn (2008) found oil palm plantation GHG emissions on peatland to be far smaller, namely only 31.4 tons of CO2/hectare/year. The differences in the study results were possibly caused, among other factors, by differences in depth and quality of the peat and management of oil palm plantations on peatland.
The results of Sabiham’s research (2013) show that carbon stocks in the upper level of peatland increases in line with the rise in the age of oil palm plants. Carbon stocks in older peatland oil palm plantations are even higher compared with carbon stocks in degraded peatland forest.
Based on the above empirical facts, oil palm plantations on peatland do not increase peatland GHG emissions; on the contrary they reduce peatland GHG emissions. Therefore, the utilization of secondary peatland for oil palm plantations managed in line with sustainability principles can reduce peatland GHG emissions compared with if they are left untended as secondary peatland areas.
24. Development of palm oil industry is against GHG emission reduction program.
President Susilo Bambang Yudhoyono promised in 2009 to the world to reduce Indonesian GHG emissions by 26 percent (by working alone) and 41 percent (with international assistance) by the year 2020. This was followed by a letter of intent between the Indonesian government and the Norwegian government in the Framework of REDD+ on May 26, 2010.And one year later on May 20, 2011 Presidential Instruction No. 10/2011, known as the forest and peatland moratorium, was issued. The presidential instruction was later extended in 2013 and again in 2015.
Regardless of the controversy, the Indonesian oil palm industry presents two solution combinations to reduce Indonesian GHG emissions. The first solution is through a mandatory policy of reducing the use of diesel fuel by replacing it with oil palm biodiesel. Replacement of diesel fuel with biodiesel reduces diesel engine emissions by 62 percent (European Commission. JRC, 2012). If this policy was fully realized, it could reduce emissions by 10.3 million tons of CO2 (2015) and 24.6 million tons of CO2 (2020). The second solution is through carbon dioxide absorption by oil palm plantations. Oil palm plantations absorb 64.5 tons of CO2 per hectare net so that the existing plantations can absorb about 691 million tons of carbon dioxide.
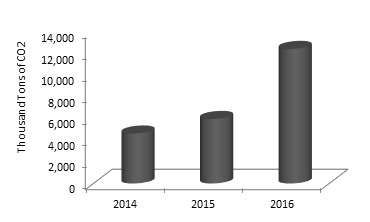
Experience of biodiesel implementation in Indonesia in the 2014-2016 period (Figure 19) shows that there is a saving in the use of fossil diesel fuel accumulatively of 4.9 million tons, thereby reducing CO2 emissions by 12 million tons of CO2. Therefore, the Indonesian palm oil industry is part of the solution of its GHG emissions-reduction program. The bigger the volume of diesel oil replaced by palm oil biodiesel, the greater the reduction of GHG emissions. Likewise, the more oil palm plantations, the higher amount of carbon dioxide will be able to be absorbed.
The Indonesian experience needs to be introduced to other countries. The government should bring its Global Emission Reduction proposal with the Mandatory Oil Palm Biofuel to international forums, including in the United States and the European Union. Indonesia should stop begging for environmental funding.
Advanced countries, currently the largest GHG producers, have to be brave enough to change their consumption of fossil fuel to biofuel from, among other sources, palm oil. They have so far made no significant contribution to the efforts toward global emissions reduction, but rather they have shifted the blame by looking for weaknesses in palm oil producers using upside down logic.


